
Inclusive Growth Commission
Maps
Household incomes by neighbourhood
This map uses recent ONS modelled estimates to show variations in average estimated household incomes (after housing costs) across neighbourhoods in England and Wales. The map also shows a range of city regions, which illustrates the scale of the inclusive growth challenge facing our cities and their hinterlands. The ONS stress that the underlying data is based on modelled estimates and there should therefore be some care in interpreting the statistics.
Inclusive Growth and Brexit
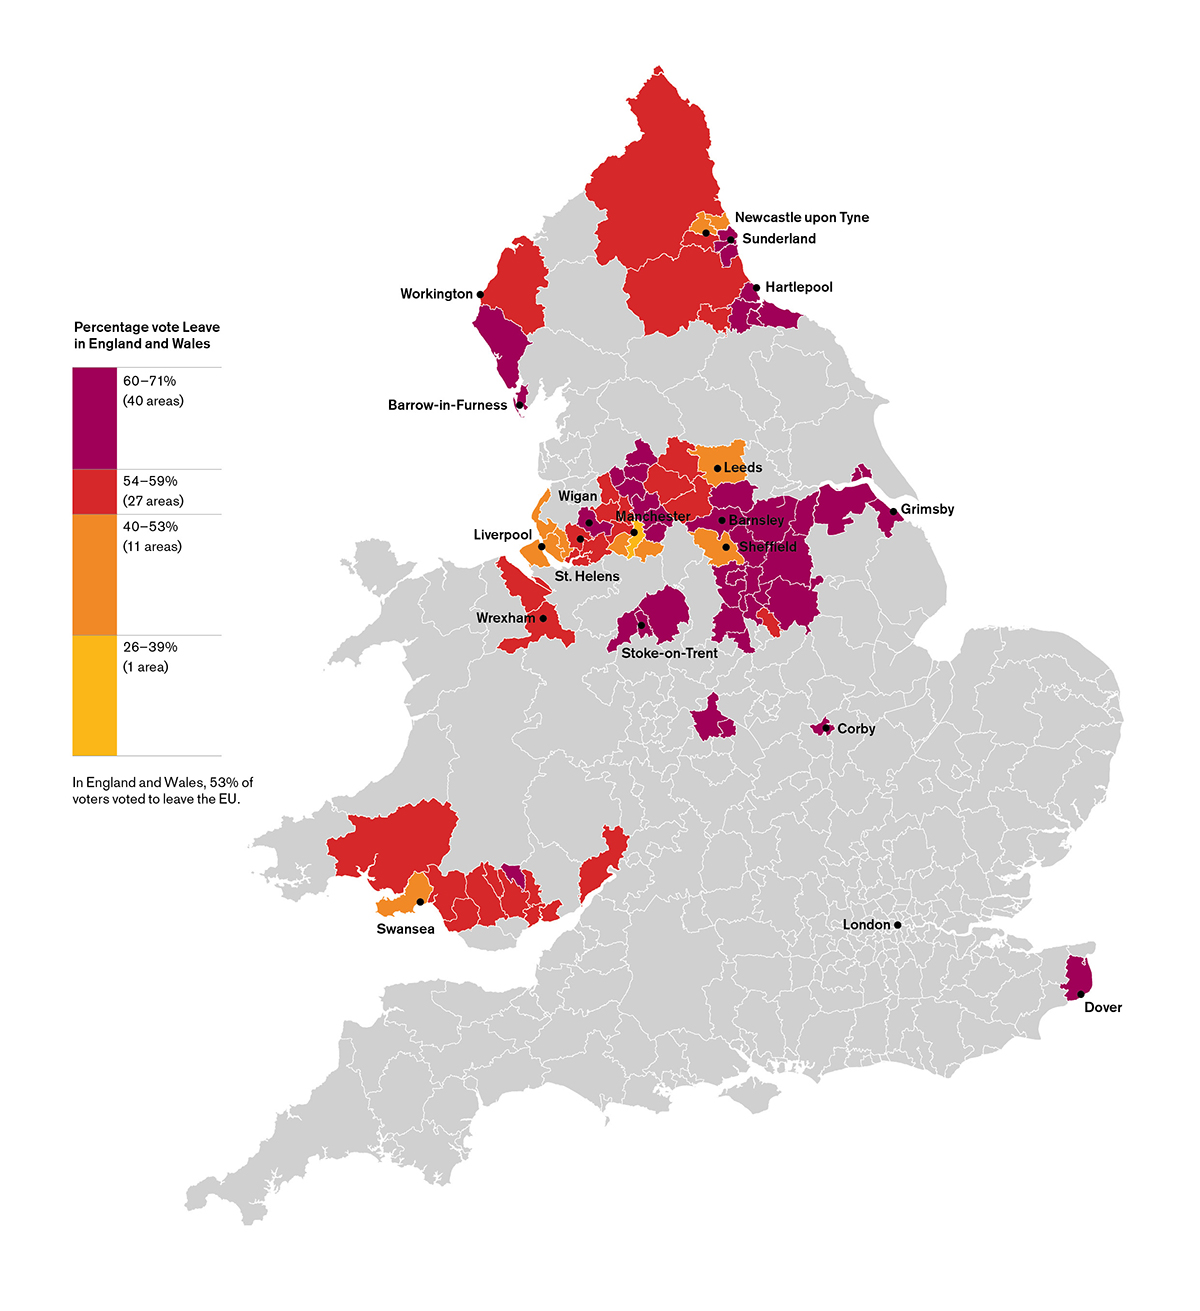
The Inclusive Growth Commission interim report highlighted how Brexit was in part driven by disaffection stemming from the long running disconnect between people (and places) and the wider economy and political institutions. The maps below show some of the dynamics at play.
The overwhelming majority of old industrial areas in England and Wales voted Leave at higher than the England and Wales average (53 percent) and around half were within the high-Brexit cohort (where 60 percent or greater voted Leave).
This provides support for claims that the EU exit was partly driven by post-industrial towns and cities in England and Wales in which many people felt ‘left behind’ by globalisation.
There is nevertheless a ‘core city’ effect: the Leave vote was significantly lower in the centre of city regions than their hinterland areas. This reflects variations in their socio-demographic profile but may also be linked to their relative success in ‘reinventing’ their economies.
The vast majority of high-Brexit areas (where 60 percent or greater voted Leave) had more workers earning below the real living wage than the UK average.

Living Wage by Place
The interactive map below shows how the percentage of workers in a place that earn less than the living wage varies considerably across the UK. Put in your town, district or postcode to see the percentage of workers in your local authority area that earn below the living wage.
Health and economic inactivity
Health has a significant impact on people’s economic prospects, and this effect is influenced by the neighbourhoods in which they live. The interactive map below (based on data from the 2011 census) shows that the percentage of economically inactive people that are too sick to work varies considerably across neighbourhoods in England and Wales. Put in a postcode to see the link between health and economic inactivity in your place.