
“It’s time we admitted that there’s more to life than money and it’s time we focused not just on GDP but on GWP – general wellbeing. Wellbeing can’t be measured by money or traded in markets. It’s about the beauty of our surroundings, the quality of our culture and, above all, the strength of our relationships. Improving our society’s sense of wellbeing is, I believe, the central political challenge of our time.” - David Cameron, Prime Minister (2010)
For many years the ‘Beyond GDP’ debate was an academic question, largely pursued on the fringes of mainstream economic and social policy making by NGOs fighting the tides of deindustrialisation, globalisation and capitalism.
But in the mid-late 2000s it began to pick up serious political traction, accelerated by the financial crash and the beginning of a new era of no, or low, growth. Building on its decade-long project, ‘Measuring the Progress of Societies’, the OECD published its Better Life Index in 2011. The following year Joe Stiglitz and Amartya Sen published the findings of their Commission on Measurement of Economic Performance and Social Progress. Meanwhile the UK Office for National Statistics was developing what was dubbed by many as the ‘Happiness Index’.
Happiness and wellbeing are important factors in society, and valuing these – as well as our ability to measure, understand and enhance them – represents a significant step in policy progress.
But in making the leap from GDP to GWP we miss a trick, underestimating the insight of other indicators as to the nature and distribution of economic growth. While some, such as GDP per capita or national Gini-coefficient, are just as blunt as the basic GDP growth measure, others – particularly at a local or sub-regional level – start to give an indication of the winners and losers of growth. Where are the pockets of concentrated unemployment? What are the key drivers of economic inactivity? Which high-skill, high-value sectors are most likely to create new jobs down the supply chain and in other aspects of the economy?
Today the new Inclusive Growth Analysis Unit have published a new set of metrics on inclusive growth, going beyond crude measures of output growth to explore the underlying dynamics between local prosperity and inclusion. Funded by the JRF and University of Manchester, the Unit has developed a tool for each of the English LEP areas, drawing upon latest data to a score places against 18 different indicators based on prosperity – skills, jobs, and economic output – and inclusion – how much this prosperity is accompanied by improvements in incomes at the bottom of the distribution, unemployment and the cost of living.
What’s clear from this analysis is that, as we instinctively know, growth is not synonymous with inclusion. Places such as Greater Manchester and Sheffield City Region have experienced rapid growth in prosperity in recent years, but both of these major metros continue to have low levels of inclusion. Meanwhile the North East has seen some of the most positive change in inclusion between 2010 and 2014, but – together with Greater Birmingham and Solihull, Liverpool, Cornwall and Sicily Islands, Humber, Tees and Black Country – continue to sit in the bottom quartile on both measures of inclusion and prosperity.
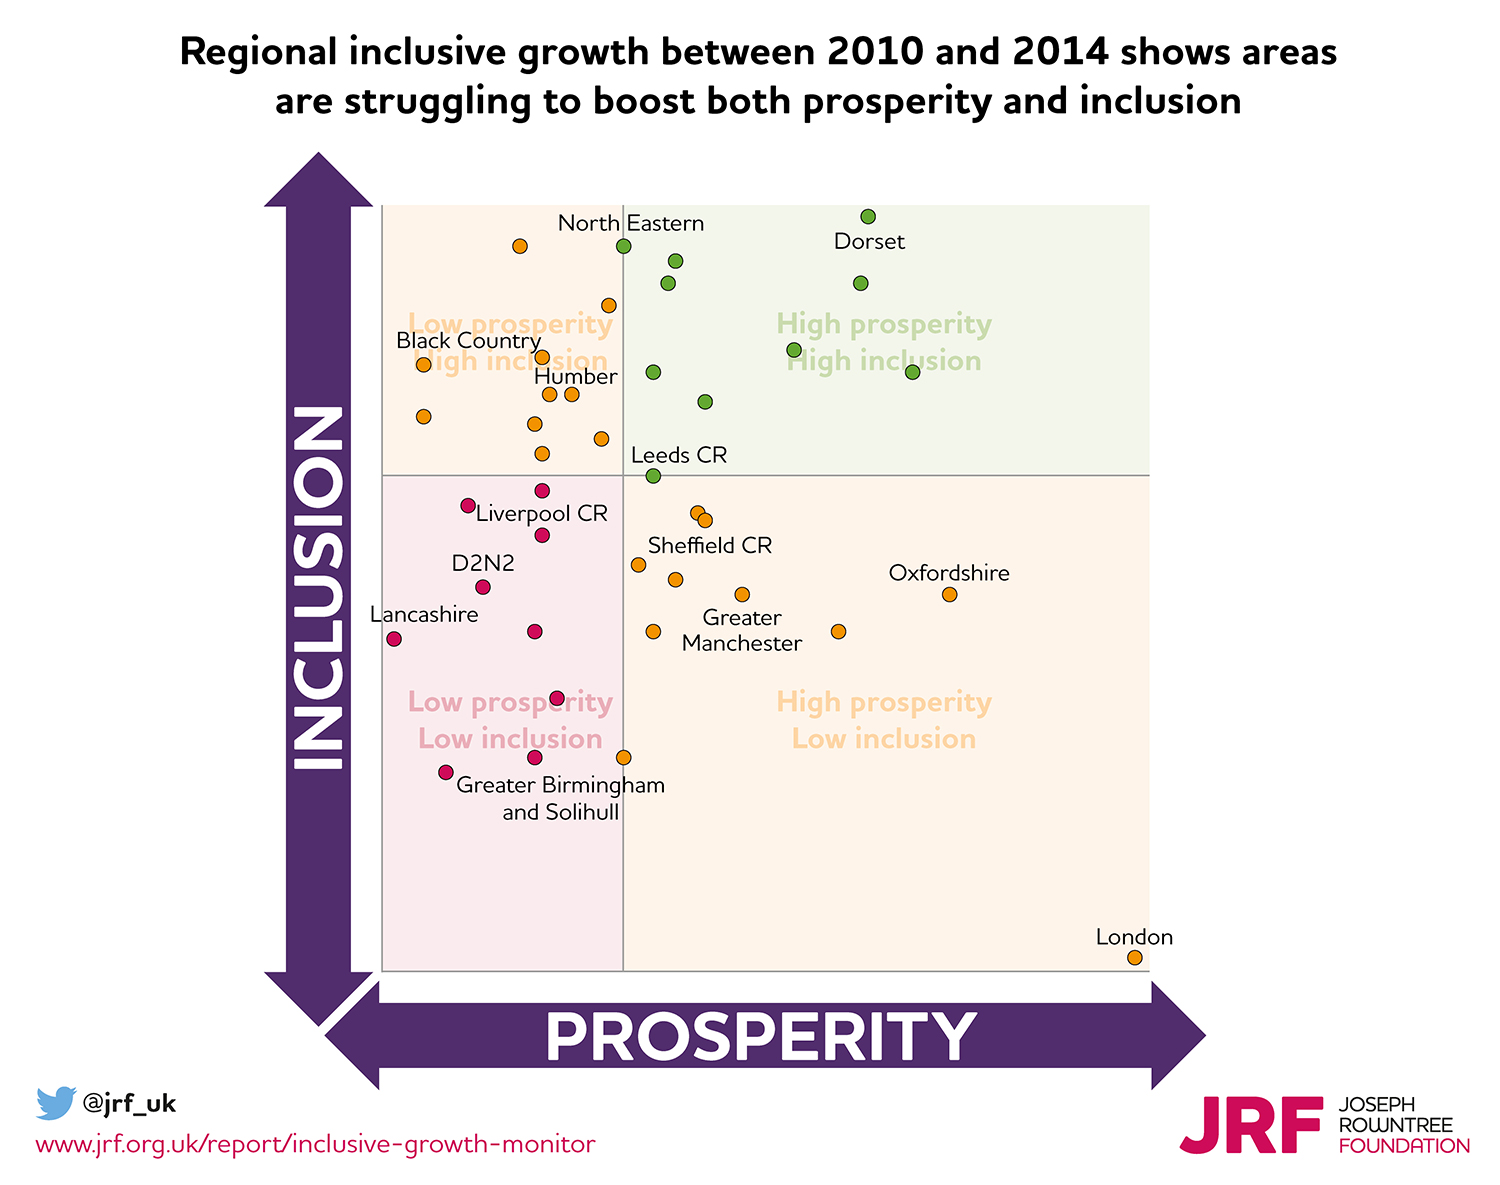
But it is in the UK capital that the challenge of how to achieve inclusive growth is perhaps most elusive. Despite topping the charts for prosperity, still driving over 20% of the nation’s total GDP growth, London languishes at the bottom of the index for inclusion. It’s not just about job creation and productivity, though. Citing previous studies, the report notes Lupton et al.'s (2013) analysis of London between 2001 and 2011, “which found that strong employment growth between 2000 and 2008 and relative economic resilience between 2008 and 2011 during the recession did not translate into lower poverty or reduced inequality.” (Noting also that London reports lower wellbeing than average for the UK.)
By committing to finding bold and practical solutions to the long-standing question of inclusive growth, the RSA’s new Commission has embarked on a huge challenge. But Professor Ruth Lupton and her colleagues in JRF and the University of Manchester have helped to make a useful start in defining and measuring what we mean by inclusive growth. Economics data need not be reduced to crude, top-line indicators, but can serve as a valuable tool for metro mayors and local leaders to drive investment decisions and policy priorities. With known links between sustainable employment and financial security on subjective wellbeing too, strategies to achieve inclusive growth might mean that improving society’s wellbeing – the PM’s “central political challenge of our time” – might be within closer reach.
Find out more about the RSA Inclusive Growth Commission
Related articles
-

A country that works for everyone? Only with inclusive growth
Stephanie Flanders
Without inclusive growth the country will become more divided outside the EU than it ever was within it, argues Stephanie Flanders.
-
A country that works for everyone? Only with inclusive growth
Stephanie Flanders
Without inclusive growth the country will become more divided outside the EU than it ever was within it, argues Stephanie Flanders.
-

To pursue inclusive growth, we need to measure it
Atif Shafique
Inclusive growth is generating growing interest. But to pursue it, we need to measure it.
Be the first to write a comment
Comments
Please login to post a comment or reply
Don't have an account? Click here to register.